ECONOMETRIA II
1
Inicio
1.1
Bienvenidos
1.2
Contexto
I Introducción
2
¿Qué es Econometría?
¿Para qué?
3
Principales conceptos
3.1
Modelo econométrico
Regresión Lineal Simple
3.2
Análisis econométrico
3.3
Tipos de Variables
3.4
Tipos de Datos
3.5
Ejemplos
Metodología Didáctica
Rentabilidad de Bonos
3.6
En resumen
4
Sobre este curso
4.1
Campus Virtual
4.2
Objetivos
Recomendaciones
4.3
Contenido
Tema 1.
El modelo de regresión logística
Tema 2.
Introducción a las series temporales
Tema 3.
Análisis descriptivo de una serie temporal
Tema 4.
Series temporales y procesos estocásticos
Tema 5.
Modelos autorregresivos
Tema 6.
Regresión con procesos no estacionarios.
4.4
Calendario
4.5
Evaluación
4.6
Bibliografía
4.6.1
En la Biblioteca
4.6.2
Links Útiles:
4.6.3
Software
4.7
Gretl
5
Cuadros de Monet
5.1
Dataset
5.2
Modelo
Naive
5.3
Variables
5.4
Variable Dependiente
5.5
Relación entre variables
Tiene Firma
Casa de Subasta
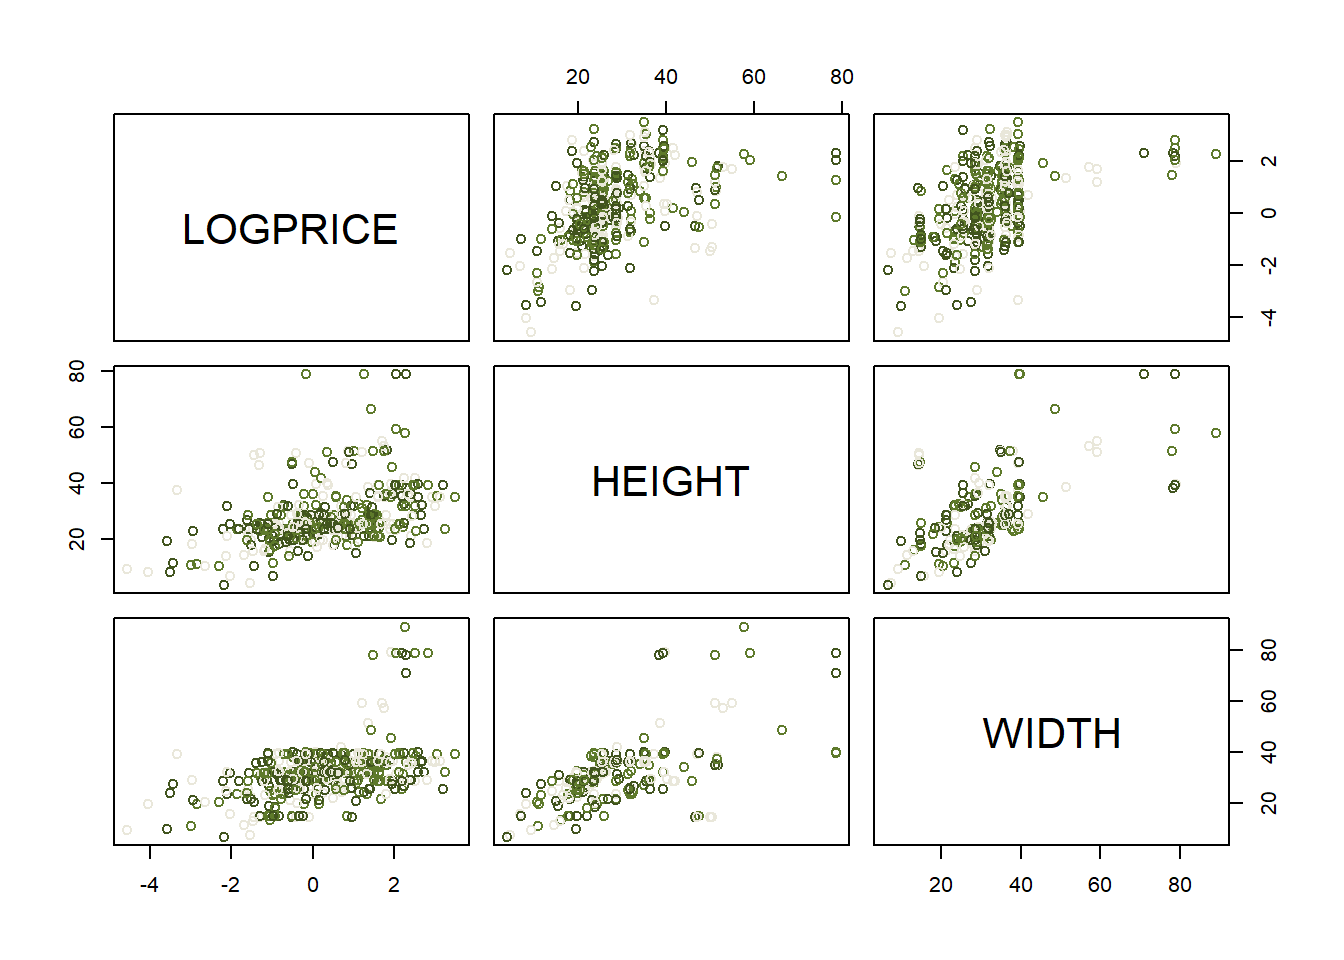
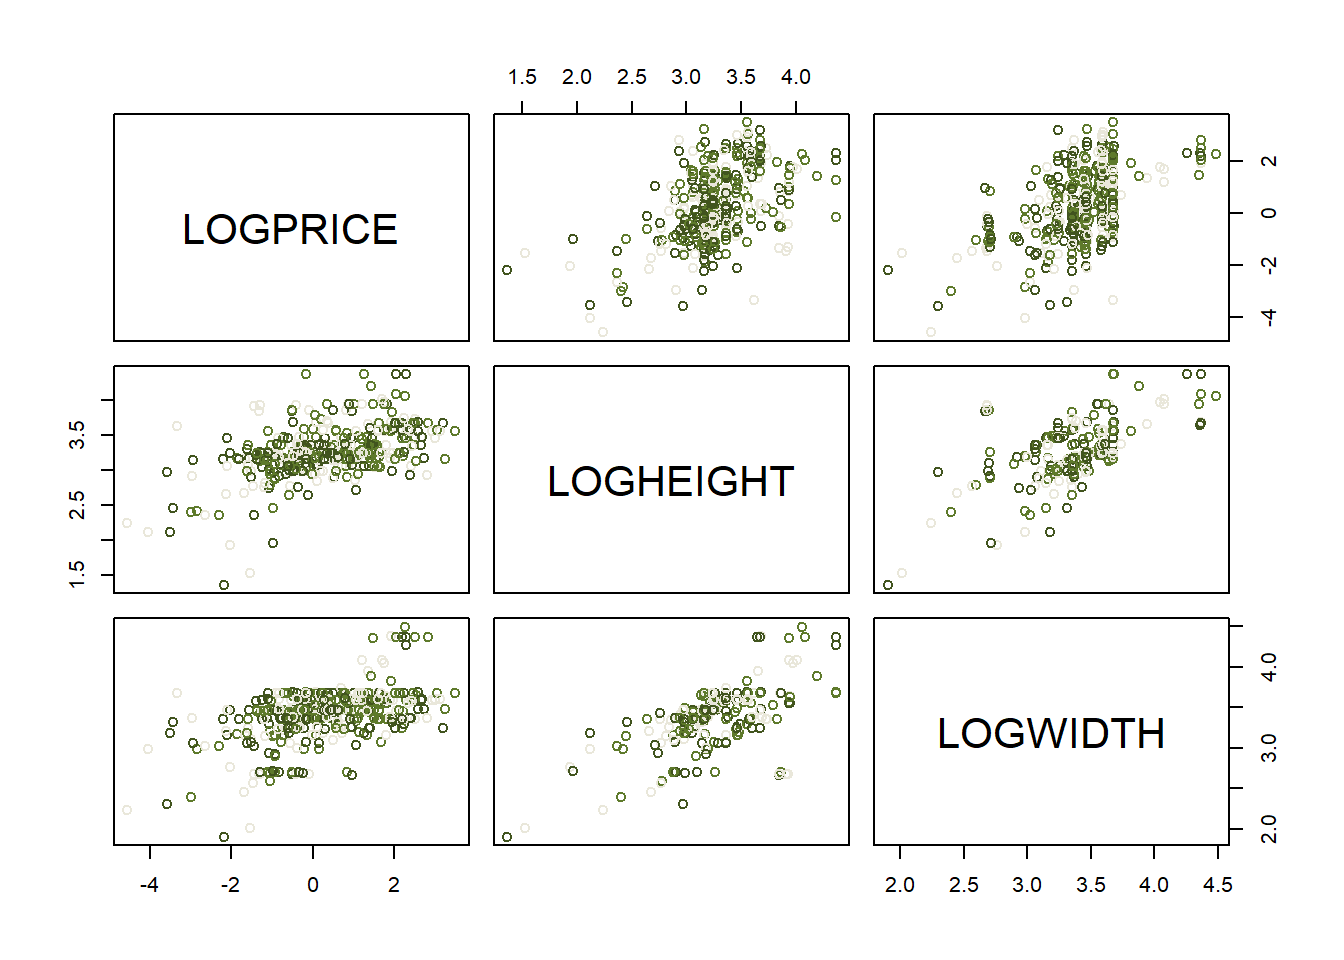
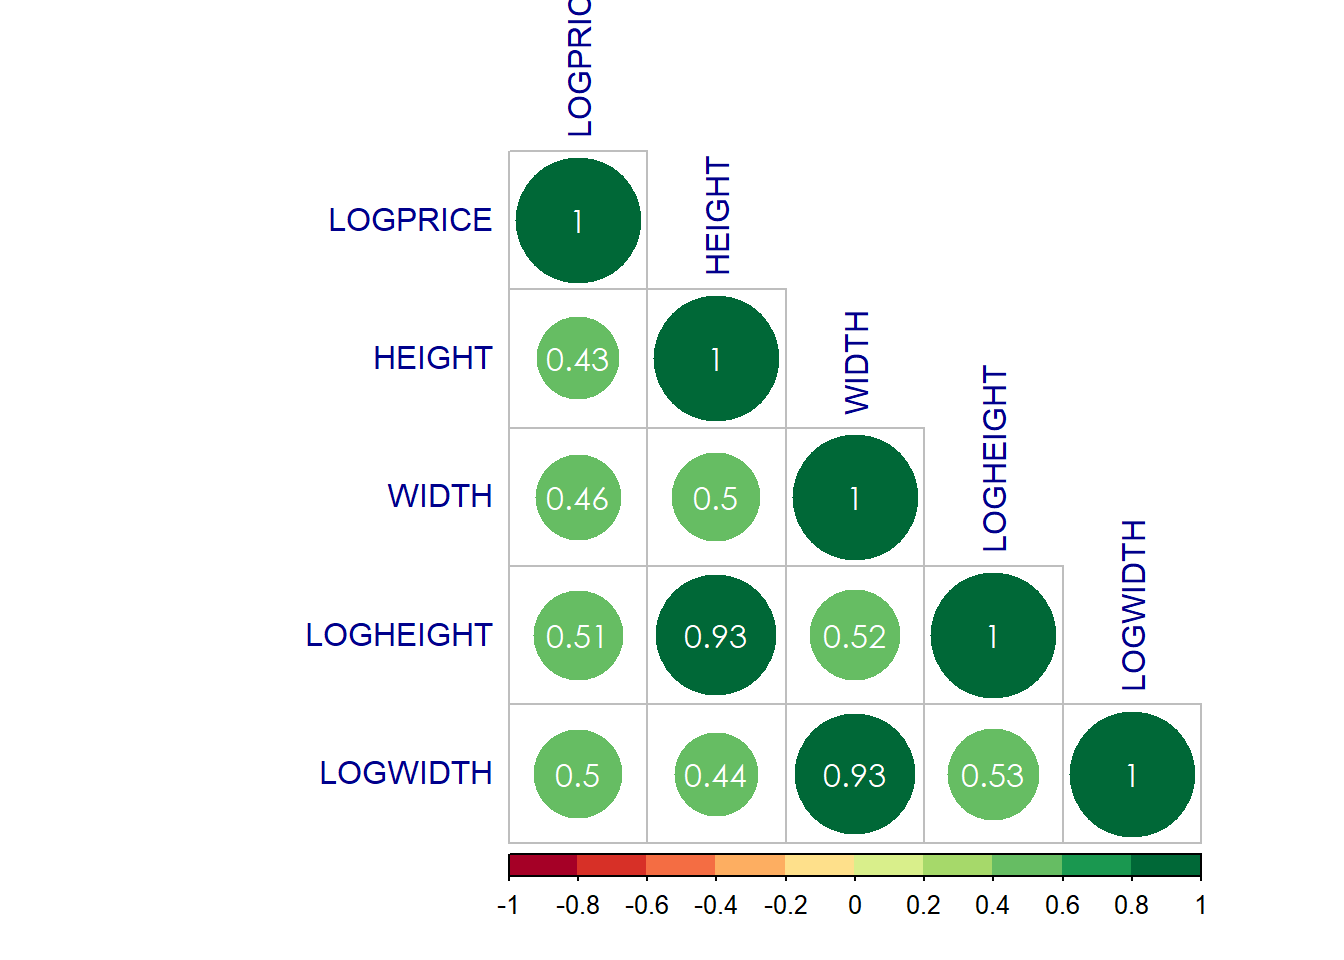
Tamaño
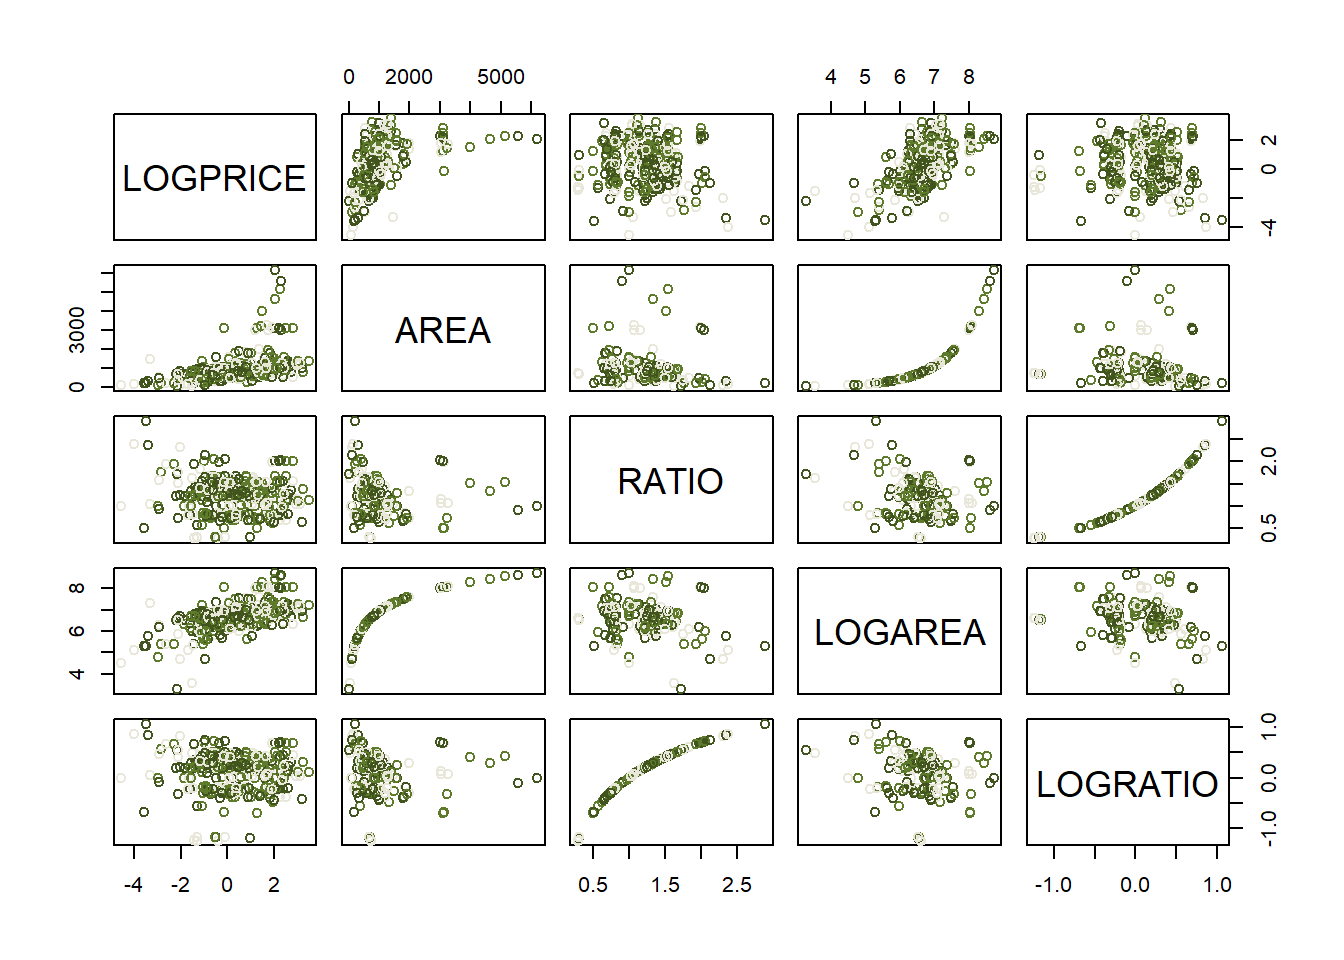
Nuevas Variables
5.6
Nuevo Modelo
6
Actividades
6.1
Datasets
6.1.1
Salarios
6.1.2
Alumnas de Estadística
6.1.3
Hospitalizados
6.1.4
Presión Arterial
6.1.5
Dulzor en pastelería
6.1.6
Muertes accidentales mensuales en los EEUU
6.1.7
Producción mensual de leche
6.1.8
Pasajeros aéreos internacionales
6.1.9
Accidentes mortales en carretera
6.1.10
Visitantes extranjeros
6.1.11
Ventas mensuales de vino
6.1.12
Precio anual del trigo
6.1.13
Rendimiento mensual de valores
6.1.14
Temperaturas mensuales
6.2
Actividad 1
6.3
Actividad 2
6.4
Actividad 3
6.5
Actividad 4
6.6
Actividad 5
6.7
Actividad 6
6.8
Actividad 7 (Opcional)
II Regresión Logística
7
Introducción
8
El Modelo
8.1
Enfermedad Coronaria
8.2
Venta de Vehículos
8.3
Tarjeta de Crédito
9
Inferencia
9.1
Variable Dependiente
9.2
Odds y Log-Odd
9.3
Estimación de Parámetros
9.4
Likelihood Ratio
9.5
Significancia de Parámetros
10
Bondad de Ajuste
10.1
Pseudo
\(R^2\)
10.2
AIC y BIC
11
Clasificación
11.1
Matriz de Confusión
12
Diagnosis
13
En Gretl
III Series Temporales
14
Introducción
Objetivos
Desafíos
Herramientas
14.1
Ejemplos
14.2
Análisis Descriptivo
14.2.1
Ejemplos
15
Modelos Deterministas
15.1
Componentes de una Serie Temporal
15.2
Modelo para Tendencia
15.3
Modelo para Estacionalidad
16
Métodos de Alisado
16.1
Medias Móviles
16.2
Alisado Exponencial Simple
17
El Modelo AR(1)
17.1
El Modelo AR(1)
17.1.1
Análisis de Residuos
17.2
Propiedades del Modelo AR(1)
17.2.1
Propiedades de un
AR(1)
17.2.2
Propiedades de un
AR(1)
18
Procesos Estocásticos Estacionarios
18.1
Procesos Estocásticos
18.2
Estacionariedad
18.3
FAS y FAP
18.4
Operador
\(B\)
18.4.1
Operador Retardo
18.4.2
Operador Diferencia
18.4.3
Operador Adelanto
18.4.4
Propiedades de B
18.4.5
Ecuaciones en Diferencias
18.4.6
Ejemplo:
19
Modelos ARMA
19.1
Ruido Blanco
19.2
Paseo Aleatorio (
Random walk
)
19.3
AR(p)
19.4
AR(1)
19.5
AR(2)
19.6
MA(q)
19.7
MA(1)
19.8
MA(2)
19.9
ARMA(p,q)
19.9.1
ARMA(1,1)
20
Construccion de Modelos
20.1
FAS y FAP teóricas ARMA
20.1.1
AR y MA
20.1.2
ARMA y ARMA Seasonal
20.2
Práctica
20.3
En Gretl
21
Calidad de ajuste
IV Procesos No Estacionarios
22
Introducción
22.1
Contrastes de Raiz Unitaria
22.1.1
Test de Dickey Fuller
22.2
Regresión Espúrea
22.3
Cointegración
22.4
Modelo de Corrección de Errores
23
Procesos No Estacionarios
23.1
Definición
23.1.1
No estacionariedad en Varianza
23.1.2
No estacionariedad en Media
23.2
Test de Dickey-Fuller
23.2.1
Test de Dickey-Fuller Aumentado
23.3
Modelos ARIMA
23.4
Test de Engle-Granger
23.5
Modelo de Corrección de Errores
23.6
En Gretl
Anexo
A
Estadística Descriptiva
B
Distribution t-Student
B.1
Grados de Libertad (df)
B.2
Area bajo la curva
Distribución Normal Standard
B.3
La tabla t
B.4
Región de Aceptación / Rechazo
C
Gretl: Paso a Paso
C.1
Referencias Externas
C.1.1
Tutorial 1
C.1.2
Tutorial 2
D
Sobre mí
Universidad Antonio de Nebrija.
Publicado with bookdown
Econometría II | Notas de Clase
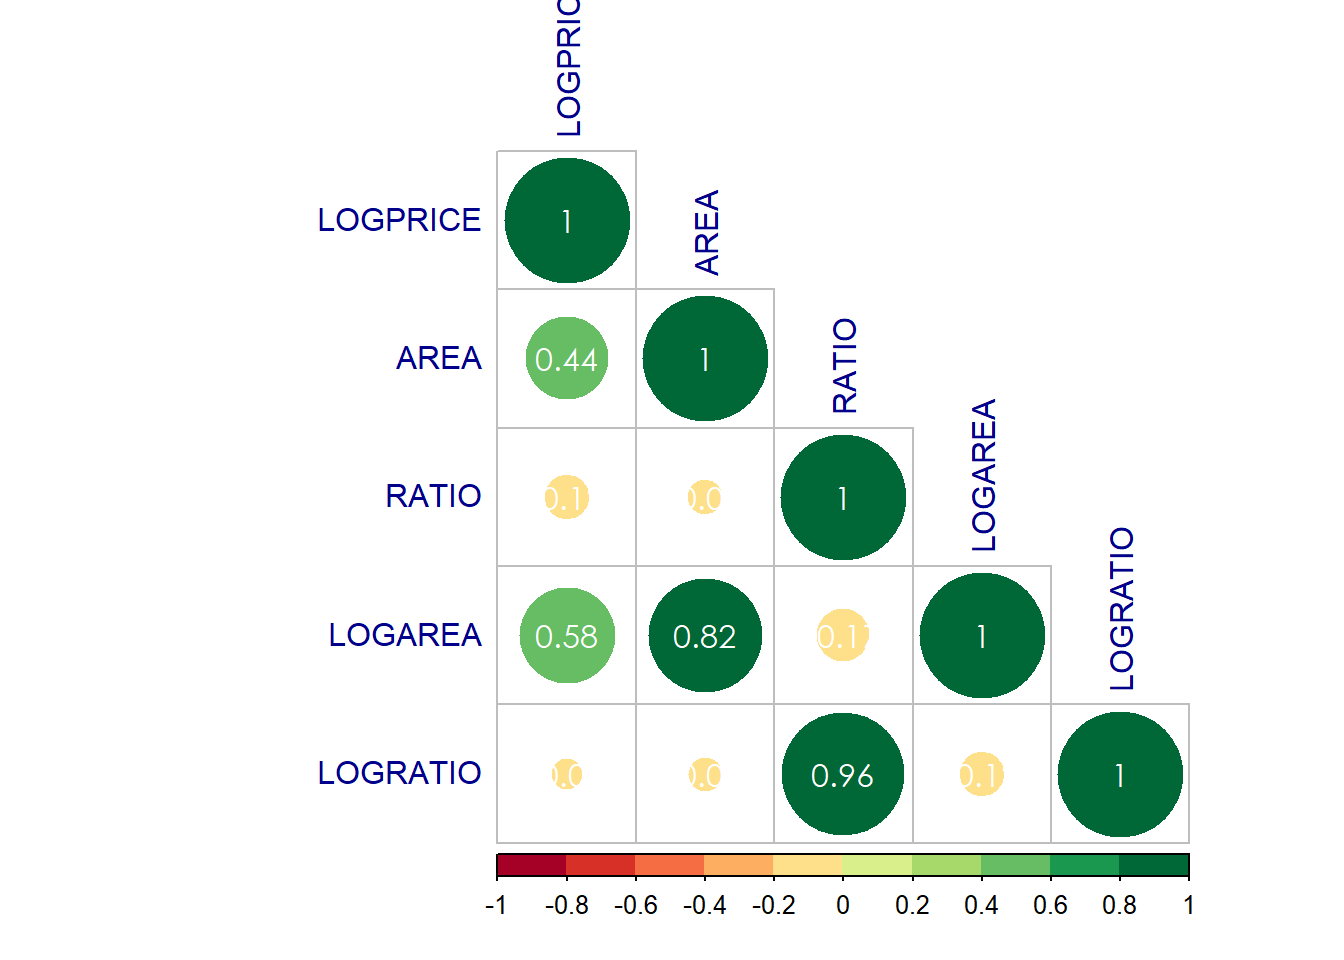
5.5
Relación entre variables
Tiene Firma
Casa de Subasta
Tamaño
Nuevas Variables
AREA
= WIDTH
\(\times\)
HEIGHT
ASPECT RATIO
= WIDTH / HEIGHT