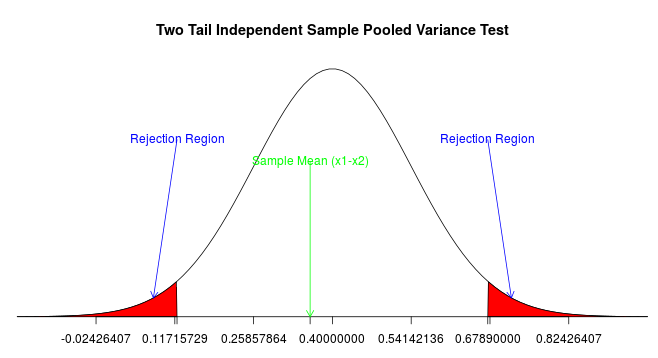
B.2 Area bajo la curva

Distribución Normal Standard

Created with Highcharts 8.1.2x = 0x = -1.96x = +1.96xp(x)Standard Normal Distribution: Area under the curveN(0,1)0.5000.0250.9750.025-5-4-3-2-101234500.10.20.30.40.5


t Distribution


Created with Highcharts 8.1.2x = 0x = -2.23x = +2.23xp(x)t-Distribution (df=10): Area under the curvet(10)0.5000.0250.9750.025-5-4-3-2-101234500.10.20.30.40.5


t Distribution: p-value


Created with Highcharts 8.1.2xp(x)t-Distribution (df=10): Area under the curvet(10)x<-3.17x < -2.03x < 0.19x < 1.41x > 1.41x < 4.14x > 4.14


Tip
You can use this app Tail probability of Student’s t Distribution to know more about t-distribution.