B.1 Grados de Libertad (df)
As the number of degrees of freedom (df) grows, the \(t\) distribution approaches the standard normal distribution (\(N(0,1)\)), and in fact the approximation is quite close for \(\text{df} \geq 30\).3
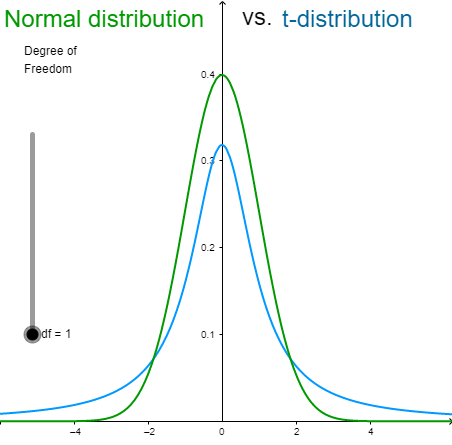
Figure below shows a comparison of \(t\) distributions with 1, 5, 10, and 30 df and the standard normal distribution. The distribution with the lowest peak is the 1 df distribution, the next lowest is 5 df, the lowest after that is 10 df, and the highest is the standard normal distribution.
Recall that with few degrees of freedom, the values of \(t\) are much higher than the corresponding values for a normal distribution and that the difference decreases as the degrees of freedom increase.4
You can use this app Normal Distribution vs. t-distribution to know more about Normal Distribution vs. t-distribution.